Daily images of rainfall and sea surface temperature observed by TRMM, and satellite orbit information can be found at "Monitoring" page. Information of events such as heavy rainfall and El Nino is archived at "Topics" page.
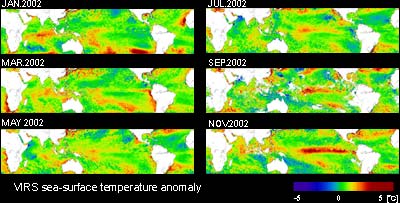
These figures observed by TRMM indicate the variation of Sea Surface Temperature (SST) and rainfall distribution related to an El Nino warm episode from January to November 2002 in every two months.
This image presents monthly mean SST anomalies estimated by VIRS. After the beginning of 2002, SSTs above those of normal years over the western tropical Pacific slowly shifted eastward. In November, an SST 2 to 3°C higher than normal is found over the central and eastern equatorial Pacific, and El Nino reached its mature stage.
Figure shows that monthly mean SST retrieved from the TMI and its deviation from the climatological monthly mean compiled by the Japan Meteorological Agency. Yellow and red areas indicate higher SST
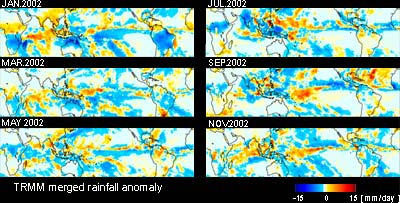
than normal years. In Figure, higher SST regions in the tropics correspond well to heavy rainfall regions in Figure 1.
Since the El Nino warm episode continued in February 1998, there are higher than normal SSTs in the Eastern equatorial Pacific and lower than normal SSTs
in the western tropical Pacific. Related to those positive and negative SST anomalies, the heavy rainfall region extending over the equatorial Pacific
normal years and less rainfall was observed in the western tropical Pacific. Such a shift of the maximum rainfall region in the tropics linked to
convective activity variations should significantly affect world weather.