The word "El Nino," which means "the little boy" (i.e., God's Child or Jesus Christ) in Spanish, originally indicated a local phenomenon in which a warm ocean current from the south intrudes into the cold sea water in the waters off Peru. At present, El Nino indicates a more global phenomenon that includes other atmosphere-ocean variations over the whole tropical Pacific. When the trade winds (easterly winds) along the equator are weakened, cold-water upwelling on the coast of Peru is weakened. The sea surface temperatures over the central and eastern equatorial Pacific, which are usually colder than the western tropical Pacific, are then increased. As a consequence of these events, locations of strong atmospheric convections are changed, significantly influencing the atmospheric general circulation fields and rainfall amounts. El Nino thus tends to cause various abnormal weather conditions throughout the world.
La Nina, which means "the little girl" in Spanish, is opposite to El Nino. When the easterly winds along the equator are strengthened, the sea surface temperatures over the central and eastern equatorial Pacific become lower than in normal years. These changes also affect the atmospheric general circulation fields. La Nina is also a trigger of abnormal weather conditions, but to a lesser extent than El Nino.
Schematic Model of Atmosphere-ocean Interaction
for El Nino, La Nina and normal conditions.
Images show distributions of sea surface temperature, depth of thermocline, anomaly of trade winds, convective activities and atmospheric circulations over the equatorial Pacific between Australia and South America. Center: Normal conditions. Because of upwelling along the South American coast caused by the trade winds, the sea-surface temperature of the eastern part is lower than that of the western part. Left: La Nina conditions. The eastern Pacific thermocline becomes shallower than normal, and the sea surface temperature becomes lower. In contrast, the western Pacific thermocline becomes deeper, and center positions of warm pools, the highest temperature regions in the western Pacific, and convective activities move westward. Right: El Nino conditions. Since the trade winds over the equator are weakened, upwelling along the coast of South America also becomes weaker. Warmer sea surface regions extend eastward over the equator, and the center of convective activities also shifts to central Pacific.
Images provided by Dr. Michael J. MacPhaden , the Tropical Atmosphere-Ocean (TAO) Project Office, Pacific Marine Environmental Laboratory (PMEL), National Oceanic and Atmospheric Administration (NOAA).
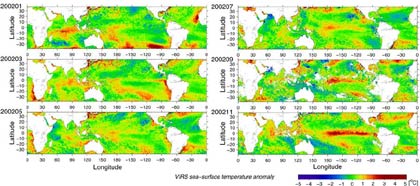
Evolution of El Nino in 2002
Since the El Nino event of 1997 and 98 was the largest on record, sea surface temperatures over the central and eastern equatorial Pacific were 4 to 5oC higher than normal. The El Nino event is now relatively small, and the peak sea surface temperature anomalies are located over the central equatorial Pacific.
VIRS sea-surface temperature anomaly
This image presents monthly mean SST anomalies estimated by TRMM Visible Infrared Scanner (VIRS). After the beginning of 2002, SSTs above those of normal years over the western tropical Pacific slowly shifted eastward. In November, an SST 2 to 3°C higher than normal is found over the central and eastern equatorial Pacific, and El Nino reached its mature stage.
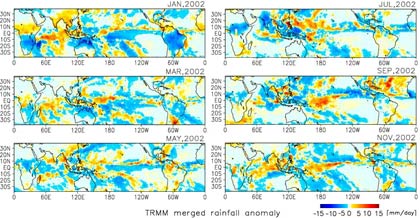
TRMM merged rainfall anomaly
This image shows monthly mean rainfall anomalies estimated by the "TRMM and Others Combined" algorithm (TRMM, IR on board geostationary satellites and rain gauges). It is clear that the variation of the SST distribution corresponds well to the changes in the distribution of rainfall all over the world. In July, more rain was over the far south of Japan, and was related to the evolution of typhoons in this area. In September, peaks of rainfall were found over the central tropical Pacific, and in November, the position of the Inter-Tropical Convergence Zone (ITCZ) shifted further southward than in a normal year.
Evolution of El Nino in 1997/98
The distribution of precipitation over the tropical Pacific is apparently different between El Nino and La Nina years. When these phenomena occur, increased rainfall is observed at seasons or locations in which little rain is observed in normal years, or, on the contrary, not observed over generally heavy rainfall regions. During the 1997/98 El Nino event, which was the strongest in the record, fire by slash-and-burn farming was not controlled and developed to large-scale fire disasters because of less rainfall over the western tropical Pacific in the rainy season.
Comparison of PR and TMI
Figures 1a and 1b show estimated monthly accumulated rainfall near the surface derived from the Precipitation Radar(PR) aboard the Tropical Rainfall Measuring Mission (TRMM) satellite for January 1998 (Fig. 1a) and 1999 (Fig. 1b). Figures 2a and 2b show sea surface temperature (SST) anomaly derived from the TRMM Microwave Imager (TMI) for January 1998 (Fig. 2a) and 1999 (Fig. 2b), which are defined as deviations from the climatological monthly mean SST compiled by the Japan Meteorological Agency.
Since El Nino still continued in January 1998,, heavy rainfall shifted from the western to the central Pacific (Fig. 1a), unlike the normal year. Due to the effects of El Nino, the Inter-Tropical Convergence Zone (ITCZ) was located along the Equator in Fig.1a, and areas of heavy rainfall in the south Pacific shifted further to the east than in normal years. In Fig. 2a, there was a much higher (red) SST than normal over the central and eastern equatorial Pacific, but a lower SST over the western equatorial Pacific.
Figure 1b shows the rainfall distribution in January 1999, after the El Nino event. Unlike Fig. 1a, there was little rainfall in the central equatorial Pacific, and ITCZ was in the normal location. In addition, heavy rain was observed in Indonesia, and the center of active convection was observed in its normal location. Figure 2b shows that the strong El Nino disappears and a colder than normal (blue) SST year occurs over the central and eastern Pacific. This corresponds to the light rainfall region in Fig.1b and indicates the El Nino cold event (La Nina).
Such shift of the maximum rainfall region in the tropics linked to convective activity variations, caused by El Nino and La Nina events, should significantly affect world weather.
Sea Surface Temperature Change
Figure shows the global sea surface temperature change from 1998 to 1999 measured by TRMM Microwave Imager (TMI).