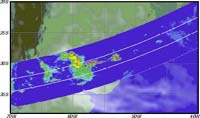
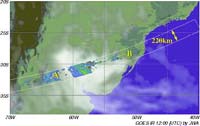
Fig.1. VIRS: RGB color composite Fig.2. TMI: 85GHz V-POL. Brightness Temperature
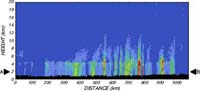
Fig.3. PR: Horizontal Cross Section of Rain at 2.0km Height Fig.4.PR: Vertical Cross Section
These images are simultaneous images of rain over northern Argentina and Uruguay from the Visible Infrared Scanner (VIRS), TRMM Microwave Imager (TMI) and Precipitation Radar (PR) from 10:40 to 10:48 on Feb. 20, 1998 (UT). Figure 1 is a colorcomposite RGB image of channels 1 (visible), 2 (near infrared) and 4 (infrared) (for red, green and blue respectively) observed by VIRS. Figure 2 shows the 85GHz, vertically polarized brightness temperature observed by TMI. Figure 3 shows the horizontal cross section of rain at 2.0km height. Figure 4 shows the vertical cross section of rain along the line AB in Fig. 3.
Optically thicker clouds at the upper layers are reddish in Fig. 1 because of the high reflectivity of ch 1 and their low temperature. Figure 3 shows that rainfall was observed in these areas. It is clear in Fig. 4 that the heavy rain developed in the layers above the heavy rain which was in the lower layers. Generally, there were ice crystals over the rain which developed at high altitudes. The brightness temperature in Fig. 2 decreased due to microwave scattering caused by these ice crystals. In this way, the rainfall process in the clouds and the characteristics of rainfall will be revealed by the simultaneous measurement by these three sensors.
TRMM Level 3 Monthly Rainfall Products May 2000
Fig.1 TMI 3A11
Fig.4 COMB 3B31 from TMI 2A12
Fig.2 PR 3A25 (Grid 1)
Fig.5 COMB 3B31 from COMB 2B31
Fig.3 PR 3A25 (Grid 2)
Fig.6 3B43 TRMM & Other Data Sources
Figures 1 to 6 show monthly accumulated surface rainfall in May 2000, selected from the TRMM Level 3 standard products (monthly and latitude-longitude grid); PR, TMI, the PR and TMI combined algorithm (COMB) and "TRMM and Others Combined" algorithm. Each algorithm is briefly described below.
3A11, "TMI Emission," produces 5° x 5° monthly oceanic rainfall maps (Fig. 1) using TMI Level 1 data.
3A25, "PR Rainfall," computes monthly mean rain rate from PR Level 2 data at both a low horizontal resolution (5° x 5°latitude/longitude for near surface and five vertical layers) and a high resolution (0.5° x 0.5° latitude/longitude for near surface and three vertical layers). Note that Figs. 2 (low resolution) and 3 (high resolution) show monthly accumulated rainfall calculatedfrom original data in order to compare with other Level 3 products.
3B31, "Rainfall Combined," uses the high-quality retrievals done for the narrow swath in combined Level 2 (2B31) data to calibrate the wide swath retrievals generated in TMI Level 2 (2A12) data. It calculates monthly accumulated rainfall at each 5° x5° latitude/longitude box for near surface (Fig. 4) and 14 vertical layers. Monthly accumulated rainfall at each 5° x 5°latitude/longitude box for near surface (Fig. 5) and 14 vertical layers calculated from 2B31 is also included.
3B43, "TRMM and Other Data Sources," provides a "best" precipitation estimate in the TRMM region from all global data sources, namely TRMM, geosynchronous IR, and rain gauges, at each 1° x 1° latitude/longitude box. Note that Fig. 6 shows monthly accumulated rainfall calculated from original data (monthly mean) in order to compare with other Level 3 products.