TANSO-FTS
The TANSO-FTS primary pointing system has a pointing offset that cannot be detected with an angular resolver. The pointing offset has been estimated using the onboard camera (CAM). The offset before Jan. 2015, changed slowly with a monthly time scale. Every two weeks after observation, the best-estimate offset values are updated, and these values are provided by the National Institute for Environmental Studies (NIES) via the GOSAT Data Archive Service (GDAS). The application of these correction values reduces the fluctuation in the geolocation to less than 1 km. Target mode planning has been implementing the pointing offset since Aug. 5, 2013. Generally, with this change plus the above-mentioned fluctuation of 1 km, the target mode observations have been performed with pointing offset less than 2 km.
The pointing offset of the secondary pointing mechanism used since Jan. 26, 2015 is different. No offset in the angular resolver has as yet been detected and the pointing settling of the secondary system is much more stable than the primary one. However, the axes of the optical path and CT rotation are slightly misaligned, which results in the CT angle-dependent offset. The L1B V201 product has corrected geolocations, and the accuracy after correction is better than 0.5 km. For target observations, the geometrical offset and misalignment between the GOSAT satellite bus and TANSO-FTS have been implemented from Aug. 30, 2015. The best-estimated pointing locations and the pointing offset are now provided in L1B V201.
The following figure shows long-term pointing offset for grid observations: AT optical angle (blue dot) and CT (red dot). The time series of FTS pointing offset are evaluated using FTS L1B(V161)data from the satellite launch to September 2016. The graphs show FTS pointing offset of grid and target mode observations.
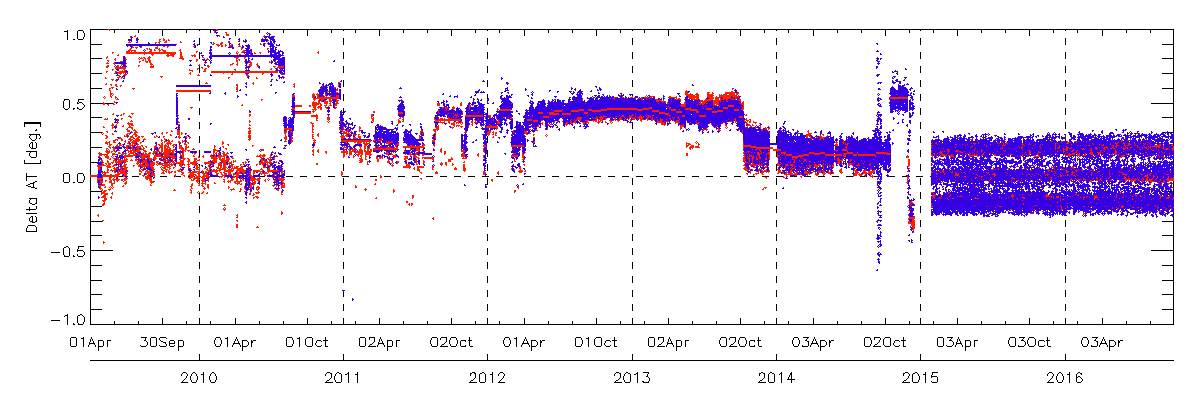
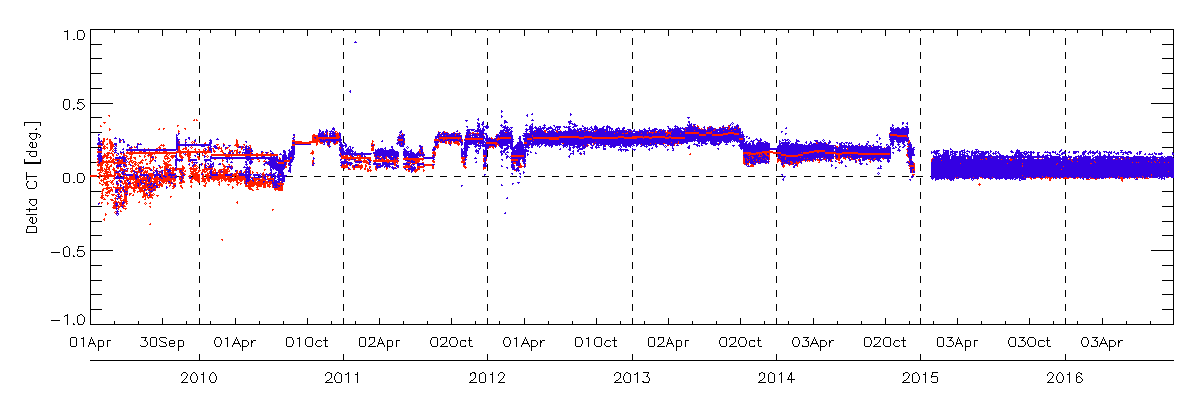
The time series of FTS pointing offset of FTS L1B(V161) using CAM data include the ground control points (GCPs).(Upper graphs : AT pointing offset angle, Lower graphs : CT pointing offset angle. Red dot show the grid mode and Blue dot show the target mode observation). Since August 2010, the grid observation pattern has changed from the 5-point CT mode to the 3-point CT scan mode. From 23, January 2015, the secondary pointing system was used.
Since January 1st, 2015, when the pointing system was switched from the primary to the secondary one, FTS pointing offset has changed. The upper graph in the following figure shows that FTS pointing offset depends on CT angle in both grid mode and target mode observation. In accordance with this trend, FTS pointing angle offset is estimated by linear equation for AT angle and quadratic equation for CT angle. The lower graph in the following figure shows the residual between the pointing offset angle and applied approximate equation.
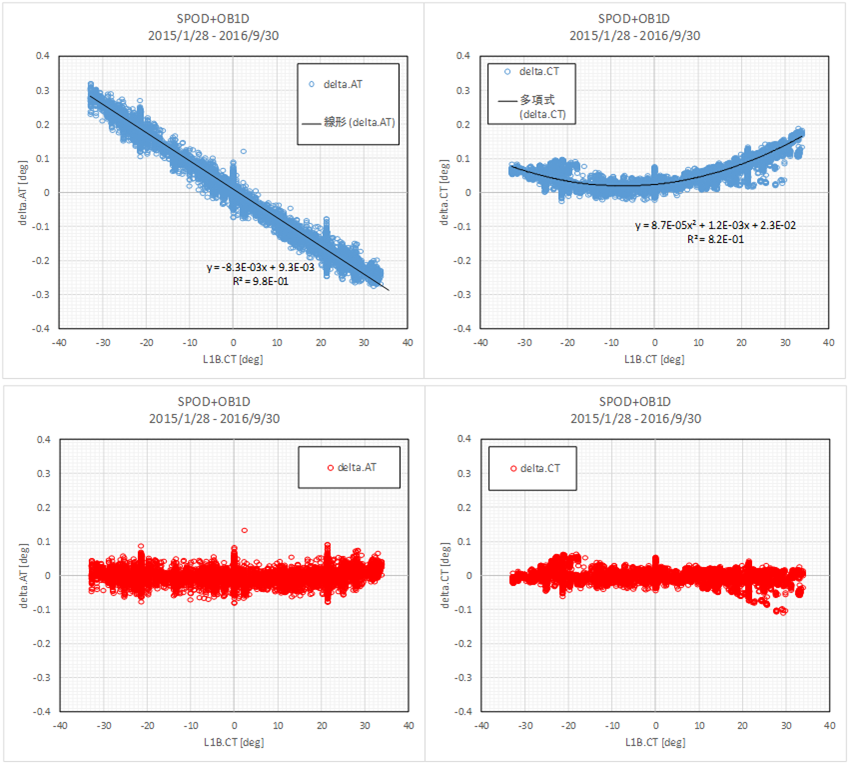 FTS pointing offset using FTS L1B(V161)data with the FTS secondary pointing system from January 1st,2015 to September 30, 2016.(Upper graph : Before correction , Lower graph : After correction using approximate)
The following figure shows the time series of FTS pointing offset of FTS L1B(V201) data from October 2010. FTS L1B(V201) data are processed with biaxial rotation offset and reduce the pointing offset depends on CT angle. The FTS secondary pointing system is stable compared with the primary system. After April 2023, the evaluation is conducted with a smaller number of scenes.
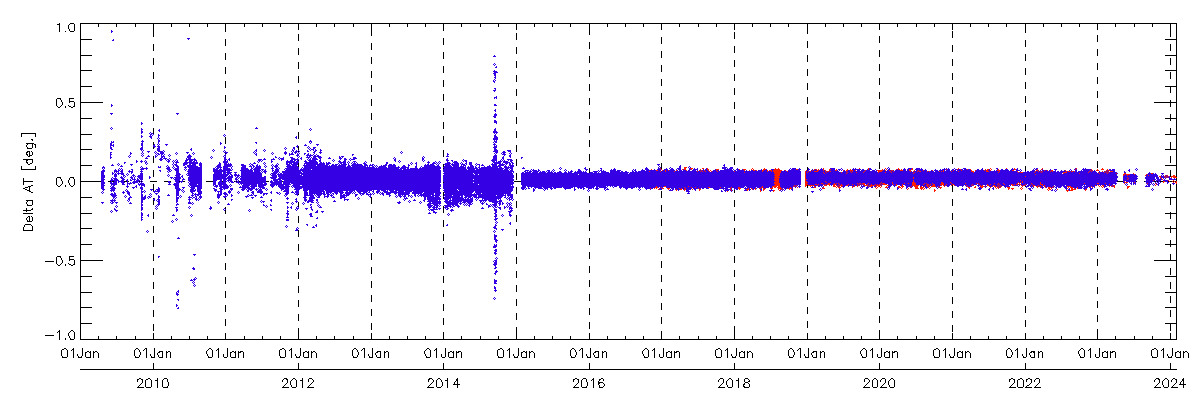
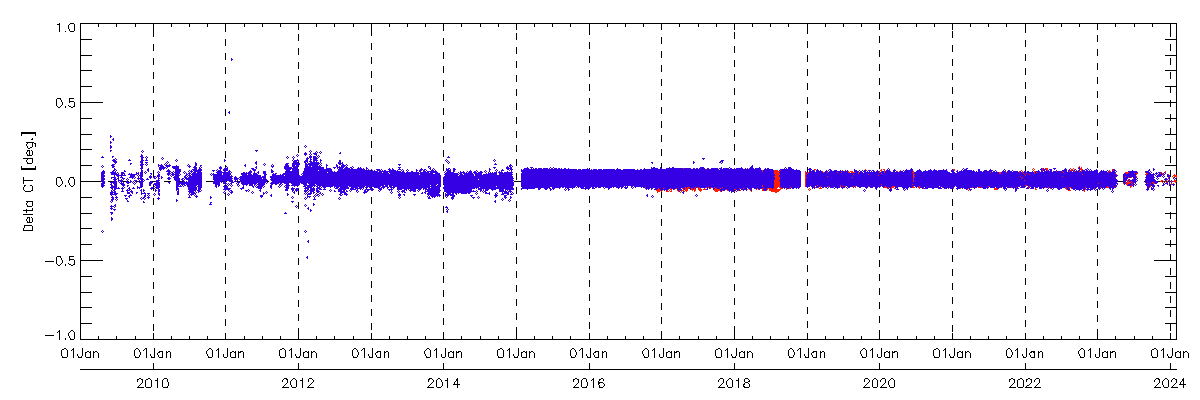
The time series of TANSO-FTS pointing offset of TANSO-FTS L1B(V201)data until Nov 30 2024.(Upper graphs : AT pointing offset, Lower graphs : CT pointing offset angle. Red dot show the grid mode and Blue dot show the target mode observation)
TANSO-CAI
The exact viewing vector of each pixel was geometrically calibrated before launch with the collimator in the laboratory. As the optical aberration and misalignment of the off-axis pixels become larger, the geometrical model of both AT and CT directions can be well expressed using a 3rd order polynomial as described below. After launch, coefficients have been revised using ground calibration points (GCP). But, the difference from the pre-launch values is very small.
 (1)
(1)
 (2)
(2)
In the above equations,  are coefficients of the polynomials,
  and
and  are the AT and CT angles from the nadir, n is the pixel number and nc is the center pixel number (256 for Band 4, 1024 otherwise).
| band 1 | band 2 | band 3 | band 4 (even) | band 4 (odd) | |
|---|---|---|---|---|---|
| Px3 | 1.1042E-11 | 1.3544E-11 | 1.1480E-11 | 2.0181E-10 | 2.0181E-10 |
| px2 | 1.2405E-08 | 7.9231E-09 | 2.6799E-09 | 1.0315E-07 | 1.0315E-07 |
| px1 | 1.4054E-05 | 2.7562E-05 | 1.8661E-05 | 7.4481E-05 | 7.4481E-05 |
| px0 | -2.5041E-02 | -2.5083E-02 | -2.7217E-02 | -7.9300E-02 | 3.7578E-02 |
| band 1 | band 2 | band 3 | band 4 | |
|---|---|---|---|---|
| py3 | -8.9523E-10 | -2.6717E-09 | -2.6257E-09 | -2.6057E-08 |
| py2 | 9.2563E-09 | -1.0567E-08 | -1.7011E-08 | 1.4569E-07 |
| py1 | 4.3143E-02 | 4.3109E-02 | 4.3053E-02 | 1.2924E-01 |
| py0 | -9.0261E-02 | -8.4981E-02 | -6.1074E-02 | -1.1705E-01 |
In the TANSO-CAI Level 1B, 1B+, and 2 data, the geolocation is corrected using the above equations and digital elevation model (DEM) data. Only Band 4 uses a 512-pixels InGaAs-detector and complementary metal oxide semiconductor (CMOS) readouts. Odd and even number pixels have two different directions of readouts respectively. The detector readout masks for even number pixels are not opaque enough and its field of view has been stretched. These anomalies are minimized by shifting the geolocation separately for the odd and the even pixels in the TANSO-CAI Level 1B, 1B+, and Level 2 products.
