Fig. 1 shows ocean surface wind speeds around Japan derived by ALOS / PALSAR ScanSAR observations on (a) 4 and (b) 11 January 2009, and Fig.2 near-simultaneous wind fields from MetOp / ASCAT*, which were observed within 2 hours of the PALSAR observations.
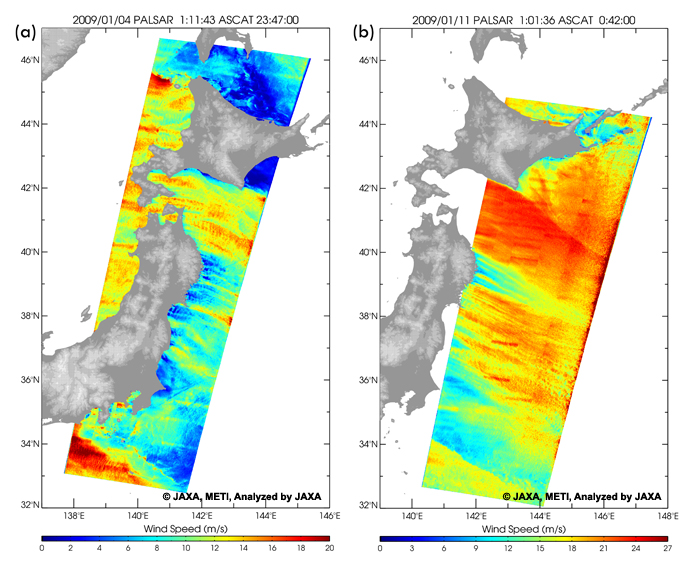
Fig. 1: Wind speed maps estimated from ALOS/PALSAR ScanSAR data
at (a) 1:11 UTC 4 January 2009, and (b) 1:01 UTC 11 January 2009.
(Click to View Enlarged Image)
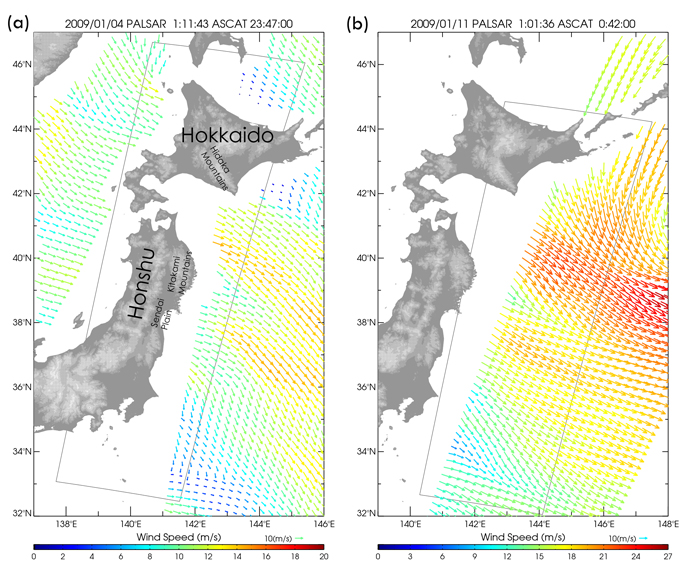
Fig.2: Ocean surface winds from MetOp/ASCAT at (a) 23:47 UTC 3 January 2009 and (b) 0:42 UTC 11 January 2009. Black frames indicate the PALSAR observation areas shown in Fig. 1.
(Click to View Enlarged Image)
Backscattering intensity of microwave from the ocean has a relationship with incidence angle, wind speed, and wind direction relative to radar azimuth angle (relative wind direction) along with wavelength and polarization. For Ku- and C-bands, empirical relations between surface wind and backscattering intensity have been formulated as Geophysical Model Function (GMF) and they are applied to a scatterometer and a synthetic aperture radar (SAR) to detect ocean surface wind. On the other hand, we did not have, up to this day, an L-band GFM which covers a wide range of incidence angle. After the launch of ALOS, the accumulation of L-band measurements over the ocean enables us to investigate their empirical relationship with ocean surface wind and then develop an L-band GMF. Fig. 3 represents the 3D views of the derived GMF at incidence angles of 30 and 40 degrees. Generally normalized radar cross section (NRCS) decreases with increasing incidence angle and increases with increasing wind speed. In terms of relative wind direction, NRCS at up- (0 degree) and down-winds (180 degree) are strong than those at cross-winds (90 and 270 degrees). For the validation of the GMF, the 220 PALSAR-derived wind speeds are compared with buoy measurements (Fig. 4), resulting in the 0.69 m/s bias and the 1.87 m/s root mean square error (RMSE).
Scatterometer can derive wind direction as well as wind speed from multi-angle measurements based on the wind direction dependency of NRCS shown in Fig.3. On the other hand, SAR, which observes NRCS from only one direction, usually estimates wind speed only by giving wind direction from the other data. In the wind speed estimation in Fig.1, we obtained wind direction from the NCEP/NCAR 6-hourly wind product (http://www.cdc.noaa.gov/).
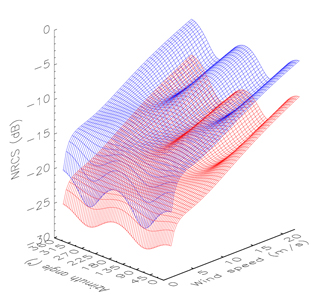
Fig. 3: 3D views of the L-band model function at (blue) 30 and (red) 40 degree incidence angles.
(Click to View Enlarged Image)
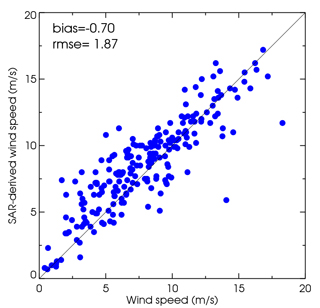
Fig. 4: Scatter plots between the PALSAR-derived wind speeds and buoy measurements.
(Click to View Enlarged Image)
Atmospheric pattern of western high and eastern low gave rise to northwestern monsoon burst on the both days. In particular, a low pressure system east of Hokkaido leads to strong northwestern wind blowing toward northern Japan on 11 January (note that wind scales in Figs. 1 and 2 are different). Figs. 1 and 2 elucidate the strong effect of topography on wind patterns blowing into the Pacific side (in the lee). A 200km-wide strong wind jet is developed between Hokkaido and Honshu and another one on the lee of Sendai Plain. A shadow zone is formed behind the Kitakami Mountains between the two jets. This major wind patter is confirmed by the scatterometer wind in Fig.2. Furthermore, the PALSAR-derived wind speeds clarify a fine-scale orographic effect. Fig. 1 (a) represents that the 200km-wide jet between Hokkaido and Honshu consists of a number of jets formed being affected by local topography. In the shadow zone behind the Kitakami Mountains, 10-km wide wind jets are formed offshore over the 200-km length. Origins of these fine-scale wind jets seem to be anchored according to upstream topography, which implies the strong orographic effect on coastal wind field. Thus SAR has a potential to detect fine-scale coastal wind fields scatterometer can not, which are useful data for coastal study.
* The MetOp/ASCAT data are provided by the Royal Netherlands Meteorological Institute (KNMI).
- Google Earth file on 4 Jan 2009 (kmz file, 1.56MB)

- Google Earth file on 11 Jan 2009 (kmz file, 1.18MB)
© METI, JAXA
Copyright©1997- JAXA EORC All rights reserved.