On March 11, 2011 (UTC), a magnitude 9.0 huge earthquake occurred off the Pacific coast of Tohoku-Kanto district in Japan (38.32°N, 142.37°E, 32 km in depth; Hypocenter information from USGS Web site), accompanied by a massive tsunami. The earthquake and tsunami caused severe damage in many cities, and more than 10 thousand people were killed and lost their homes. The Japan Aerospace Exploration Agency (JAXA) performed an emergency observation on March 15 using the Phased Array type L-band Synthetic Aperture Radar (PALSAR) installed on the Advanced Land Observing Satellite (ALOS). In this report, we conduct differential interferometric SAR (DInSAR) processing to detect crustal deformation associated with the earthquake using PALSAR data acquired before (October 28, 2010) and after (March 15, 2011) the earthquake.
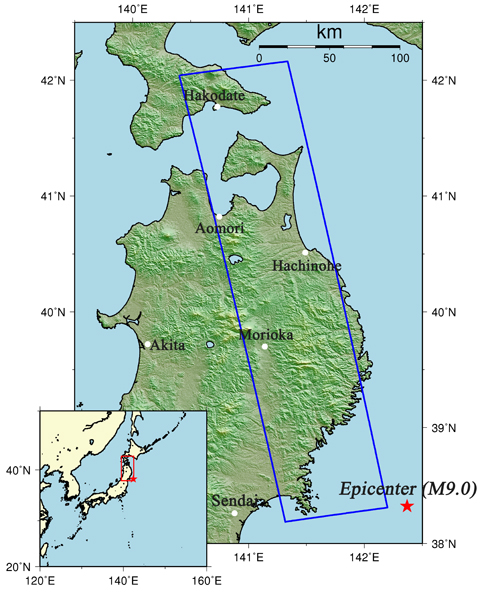
Fig.1: An overall view of the observation area (We refer to SRTM3 as terrain data).
(Click to View Enlarged Image)
The blue rectangle indicates the observation area shown in Fig. 2. The red star represents the epicenter of this earthquake.
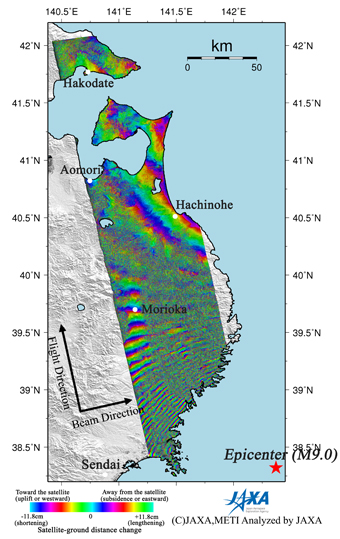
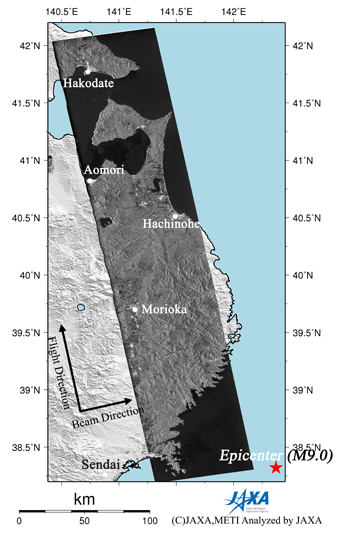
Fig.2: PALSAR interferogram indicating crustal deformation (left) and PALSAR amplitude image observed after the earthquake (March 15, 2011) (right).
(Click to View Enlarged Image)
Figure 2 left is an interferogram generated from PALSAR data acquired before and after the earthquake using the DInSAR technique. A color pattern illustrates changes of satellite-ground distance for the period. Figure 2 right is a PALSAR amplitude image acquired after the earthquake indicating an observation field of about 350 km from south to north. In the interferogram, there are so many color fringes and we can count at least 25 cycles of fringes. We interpret that ground movements away from the satellite around the coastal area relative to the tip of Shimokita Peninsula are more than 3m. Considering a mechanism of this earthquake, the color pattern indicates a subsidence or eastward displacement in the area.
JAXA plans to continue ALOS observations of the afflicted area.
* The color changes from blue to red, yellow, green, and back to blue indicate an extension (and an opposite pattern indicates a shortening) of the satellite-ground distance. One color cycle is equal to 11.8 cm.
©JAXA EORC
Copyright©1997- JAXA EORC All rights reserved.