On July 15, 2009 (UTC), magnitude 7.6 earthquake occurred off southwest coast of the south island, New Zealand. The Japan Aerospace Exploration Agency (JAXA) performed an emergency observation right after the earthquake using the Phased Array Type L-band Synthetic Aperture Radar (PALSAR) installed on the Advanced Land Observing Satellite (ALOS) to determine the state of damage caused by the earthquakes. In this report, we conducted differential interferometric SAR (DInSAR) analysis to detect crustal deformation using the data acquired on July 15, 2009 and February 22, 2007.
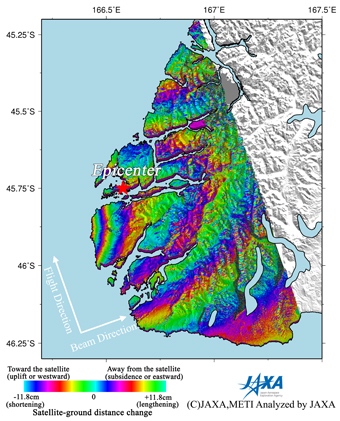
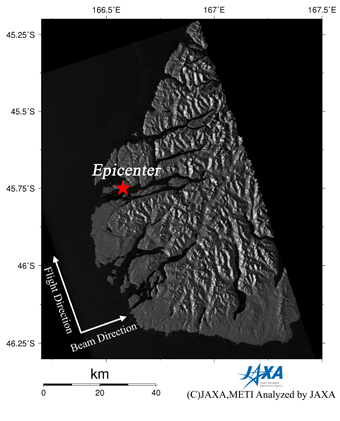
Fig.1: PALSAR interferogram (left) and PALSAR amplitude image (right)
(Click to View Enlarged Image)
Figure 1 left is an interferogram generated from PALSAR data acquired before and after the earthquake using the DInSAR technique. A color pattern illustrates changes of satellite-ground distance for the period. Figure 1 right is a PALSAR amplitude image acquired after the earthquake indicating an observation field of 100km from south to north. In the interferogram (Fig. 1 left), there are several color fringes centered in southwest of the epicenter. This color pattern is interpreted to represent a shortening of satellite-ground distance. This indicates several tens of cm of crustal deformation including an uplift or westward displacement caused by the seismic faulting.
JAXA plans to continue ALOS observations of the afflicted area in the southwest of New Zealand.
* The color changes from red, blue, green, yellow and back to red indicate an shortening of the satellite-ground distance, and one color cycle = 11.8cm.
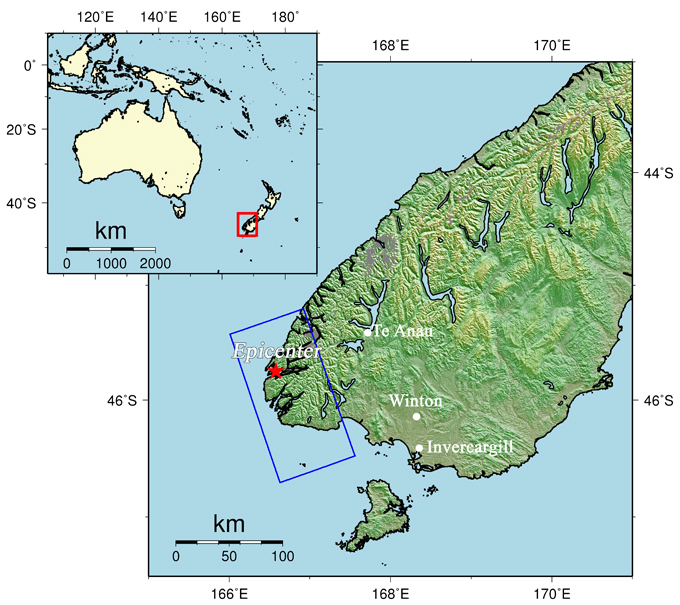
Fig.2: Overall view of the observation area.
(Click to View Enlarged Image)
©JAXA EORC
Copyright©1997- JAXA EORC All rights reserved.