8. Oceanography and Coastal Zone Related Research
Measurement of Ship Velocity Vector with JERS-1 OPS
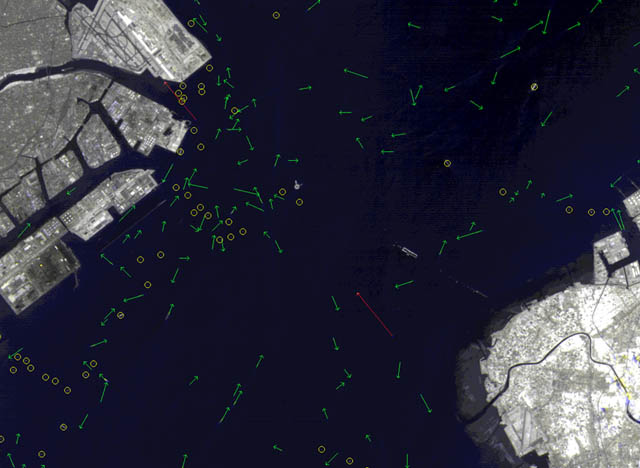
Fig. 1: Measurement of ship velocity vector with JERS-1 OPS (Sep. 9, 1992).
(Click to View Enlarged Image)
 The JERS-1 OPS has a nadir-view band and a front-view band inclined 15.3 degrees in front. The front-view band first observes an area, then, the nadir-view band observes the same spot 21 second later. The volume of ships traveling through the area can be measured from a stereoscopic pair images combining the nadir-view and front-view.
This image depicts Tokyo bay on 9 September 1992. The yellow circles are stationary ships; the green arrows are moving ones. The length of travel is exaggerated fourfold. The red arrows represent which airplanes are about to land at Tokyo International Airport. It can be seen that ships are concentrated in the areas of Tokyo Bay and Kawasaki and Yokohama Harbors. This method has made it easy to ascertain current ship navigating conditions over a wide area.
Extract from the JERS-1 Earth View published by NASDA EORC
©RESTEC