Data Application Researches
3. Digital Elevation Model (DEM) and Mapping
Monitoring Urban Development by Optical Sensor
3. Digital Elevation Model (DEM) and Mapping
Monitoring Urban Development by Optical Sensor
Monitoring Water Front of Tokyo Bay by Optical Sensor
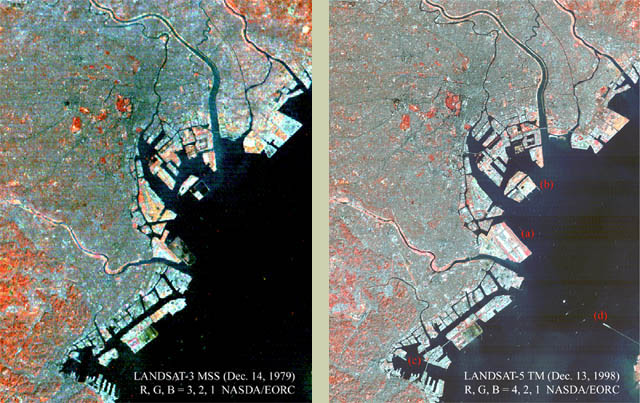
Fig. 1: False color image obtained by LANDSAT-3 MSS
in Dec. 14, 1979
(R, G, B = ch. 3, 2, 1).
in Dec. 14, 1979
(R, G, B = ch. 3, 2, 1).
Fig. 2: False color image obtained by LANDSAT-5 TM
in Dec. 13, 1998
(R, G, B = ch. 4, 2, 1).
in Dec. 13, 1998
(R, G, B = ch. 4, 2, 1).
Figure 1 and 2 show images of Tokyo Bay acquired by LANDSAT-3 MSS in 1979, and by LANDSAT-5 TM in 1998 respectively. It is realized how the three rivers flowing into the Tokyo Bay, the Tama River, the Sumida River and the Edo River have changed in the 20 years. The development of coastal area can be also recognized, which are for example, (a) the expansion of Haneda air port, (b) landfill, (c) Yokohama Bay Bridge, (d) Aqua Line of Tokyo bay (Umihotaru). As shown in this example, satellite images can be of help for assessment and monitoring of river basin and bay area development programs, and influences upon scenery and environment.
©JAXA EORC