11.Hydrology and Water Resource Management
Soil Moisture Distribution Derived by JERS-1 SAR
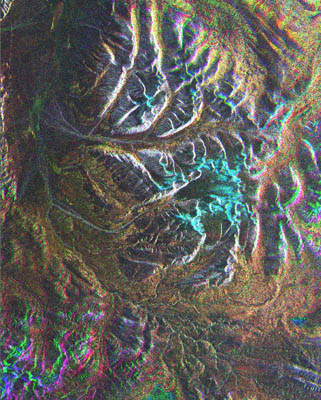
Fig. 1: Overlaid image of JERS-1 SAR obtained in January (blue), May (green), and August (red), 1993.
(Click to View Enlarged Image)
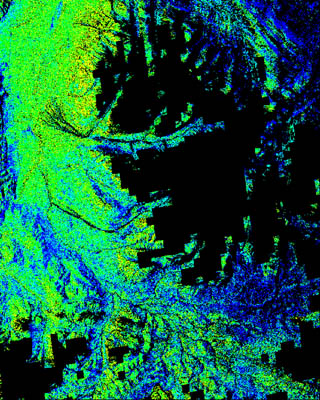
Fig. 2: 50m mesh soil moisture distribution on August 17, 1993.
(Click to View Enlarged Image)
 Soil moisture is a key parameter in numerous environmental studies, including hydrology, meteorology, and their interaction fields. In cold regions, hydrological processes due to the melting of snow and permafrost are considered to play predominant roles in global atmospheric circulation as well as the seasonal march and interannual variation of the climate.
Figure 1 shows the processed JERS-1 Synthetic Aperture Radar (SAR) images in 1993 in Tanggula Mountains located on the Tibetan Plateau. The January and May images are overlaid on the August image using three-dimensional Affine transformation and nearest-neighbor interpolation. The yellow and red area is very wet in summer and very rough with earth hammocks. The blue area corresponds to the accumulation area of the glacier.
Figure 2 shows a 50-meter mesh soil moisture map derived from Fig. 1 in August 1993. In winter, the ground surface on the plateau is perfectly frozen and dry. The surface roughness map is thus obtained from the winter SAR image by applying the scattering model that consist of both components with surface and volume scattering, and the relationship between two surface roughness parameters such as rms, height and correlation length. In summer, the soil moisture is increased by rainfalls and melting of the permafrost. The soil moisture map in summer is derived from SAR image by applying the scattering model and the surface roughness map. Yellow indicates a dryer area; blue, wetter. The black pixel shows the masking area due to high mountains the soil moisture and can not be estimated. This result shows not only the quantitative surface soil moisture but also the pattern of distribution.
Extract from the JERS-1 Earth View published by NASDA EORC
©JAXA EORC