ALOS-2/PALSAR-2 Observation Result for Eruption of Mt. Kilauea and Earthquake in Hawaii (3)
Posted: Jun. 5, 2018, 9:00 (UTC)
Updated: Jun. 8, 2018, 5:00 (UTC)
Updated: Jun. 13, 2018, 9:00 (UTC)
Overviews
- Mt. Kilauea in Big Island, Hawaii, has been erupting since May 3.
- JAXA performed an emergency observation by ALOS-2 (“DAICHI-2”) on May 31, 2017 (UTC), and captured surface displacement around Halemaumau Crater and area of lava flow around Leilani Estates.
- The observation image on June 5, 2018 showed the subsidence of Halemaumau Crater.
- The observation image on June 9, 2018 showed a new land has been formed due to lava intrusion into ocean.
- The observation data were provided to local institutions. ALOS-2 will be able to be contributed to monitor volcanic activity regardless of clouds, volcanic plumes, and sun light.
| Observation time (UTC) | Orbit number | Observation mode | Polarization | Observation direction | Beam number | |
| ① | May 31, 2018 | 186 | ScanSAR | HH+HV | Right | W2 |
| ② | June 5, 2018 | 89 | Stripmap 3m | HH | Right | U2-6 |
| ③ | June 9, 2018 | 185 | ScanSAR | HH+HV | Right | W2 |
*Please see ALOS-2/PALSAR-2 Observation Result for Eruption of Mt. Kilauea and Earthquake in Hawaii(2) for observations between May 22 and 30, and ALOS-2/PALSAR-2 Observation Result for Eruption of Mt. Kilauea and Earthquake in Hawaii for observations before May 22.
 Fig. 1: Topography on Big Island and the observation area by ALOS-2. The red rectangle shows the area by data ② and the blue one does that by data ③ in Table 1. The black one shows the area shown in Fig. 2, 4, 5, and 7.
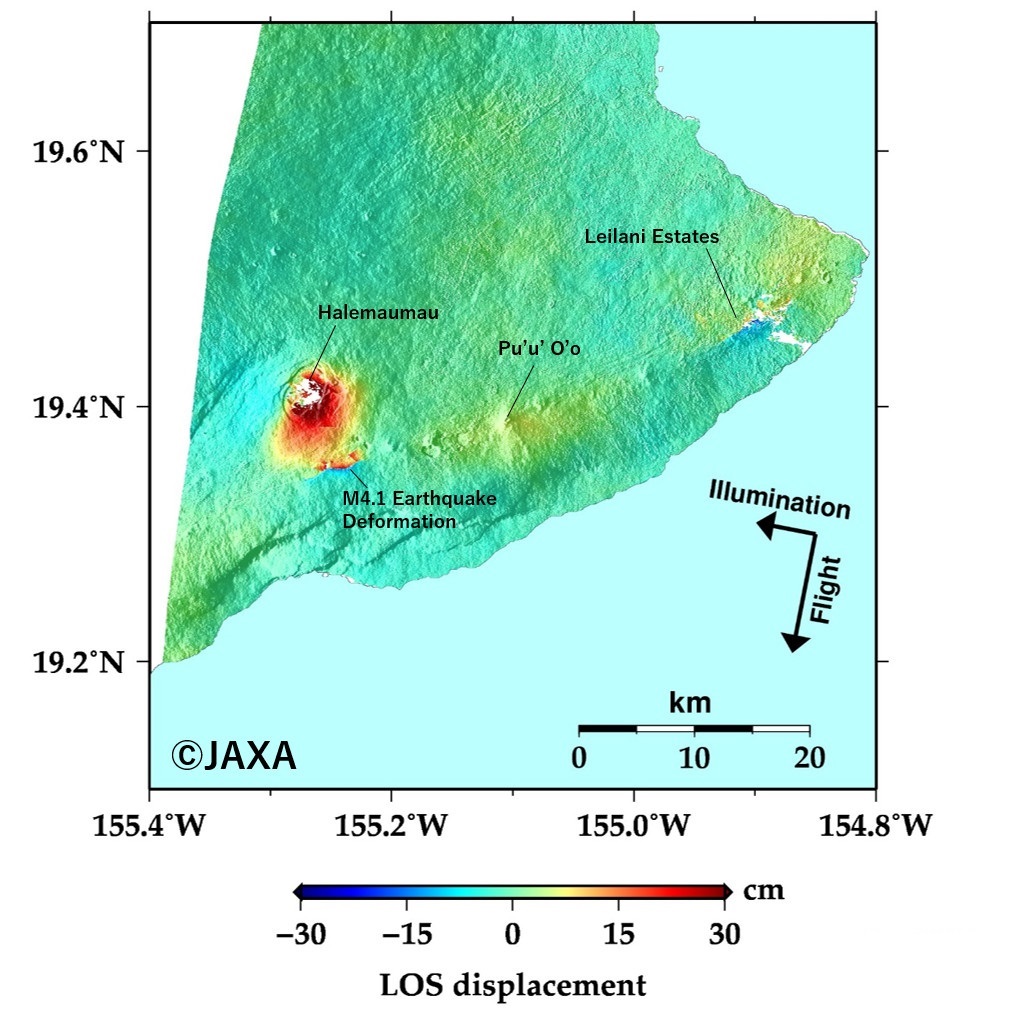 Fig. 2: An interferometric image of the ALOS-2 PALSAR-2 data acquired on May 17 and May 31, 2018.
(Click to view enlarged image)
Figure 2 shows the interferogram using the ALOS-2 PALSAR-2 data acquired on May 17 and 31, 2018. This image shows ~10 cm displacement toward the satellite (uplift or eastward) in Leilani Estates. There is also ~50 cm displacement away from the satellite (subsidence or westward) around Halemaumau Crater. Moreover, we can see the crustal deformation due to M4.1 Earthquake on May 28 (Local time) in south side of the crater.
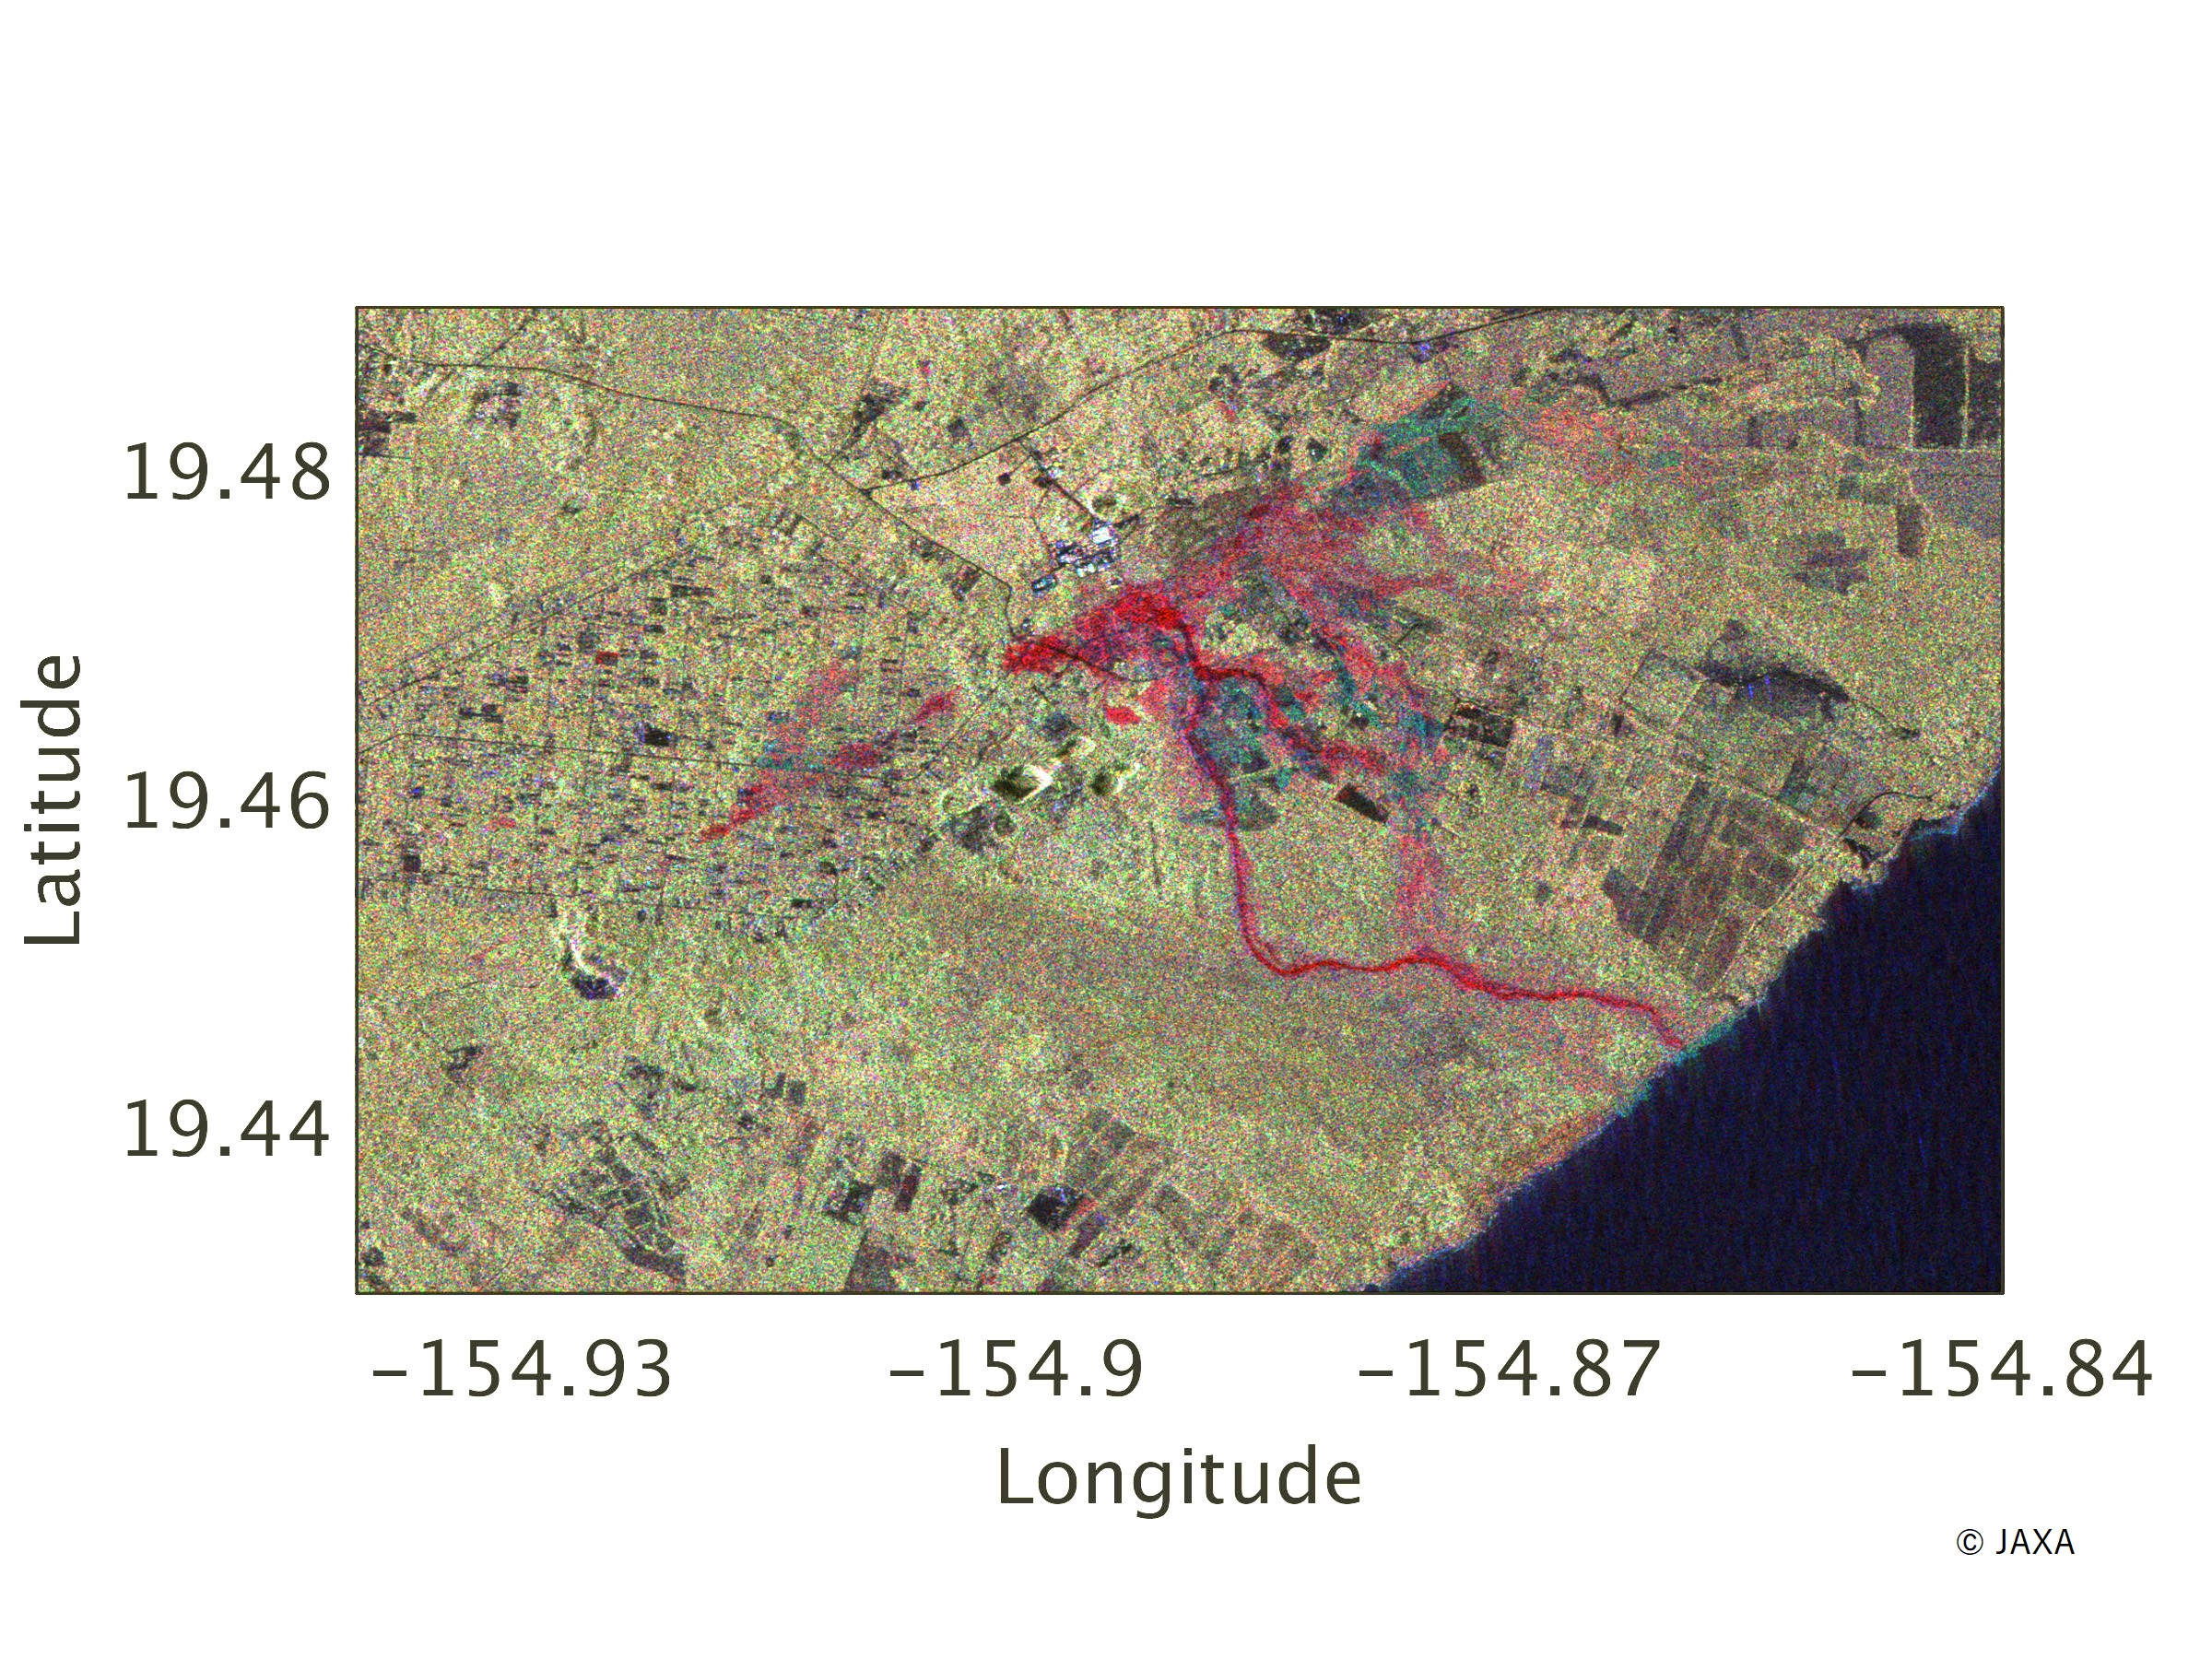
 Fig. 3: Polarimetric color-composite image of the ALOS-2 PALSAR-2 data acquired on May 17 and May 31, 2018, around Leilani Estates.
(Click to view enlarged image)
Figure 3 shows a color-composite image (red: May 14 HV polarization, green: May 31 HV pol., blue: May 31 HH pol.) where eruptive fissures and lava flow can be seen in red color. This image shows the area of lava flow has been expanding compared with the previous image.
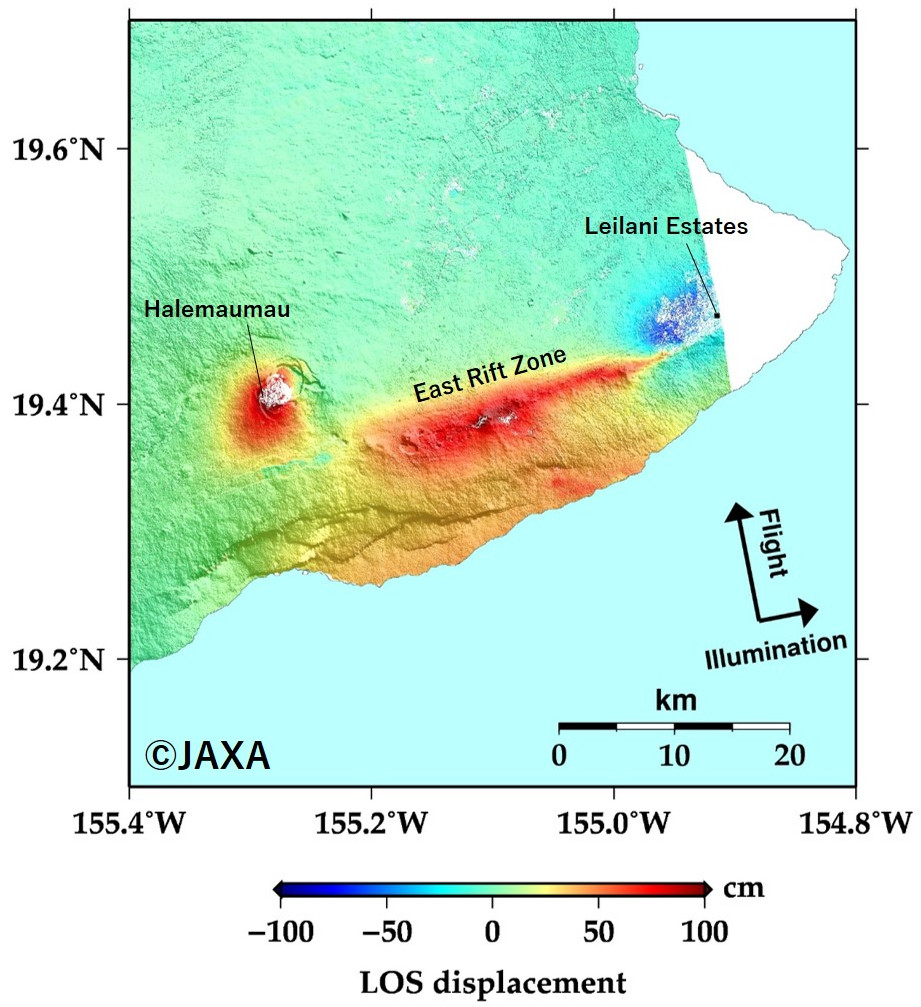 Fig. 4: An interferometric image of the ALOS-2 PALSAR-2 data acquired on December 19, 2017 and June 5, 2018.
(Click to view enlarged image)
Figure 4 shows the interferogram using the ALOS-2 PALSAR-2 data acquired on December 19, 2017 and June 5, 2018. This image shows ~70 cm displacement toward the satellite (uplift or westward) in Leilani Estates, ~100 cm displacement away from the satellite (subsidence or eastward) along East Rift Zone, and ~90 cm displacement away from the satellite (subsidence or eastward) around Halemaumau Crater, respectively.
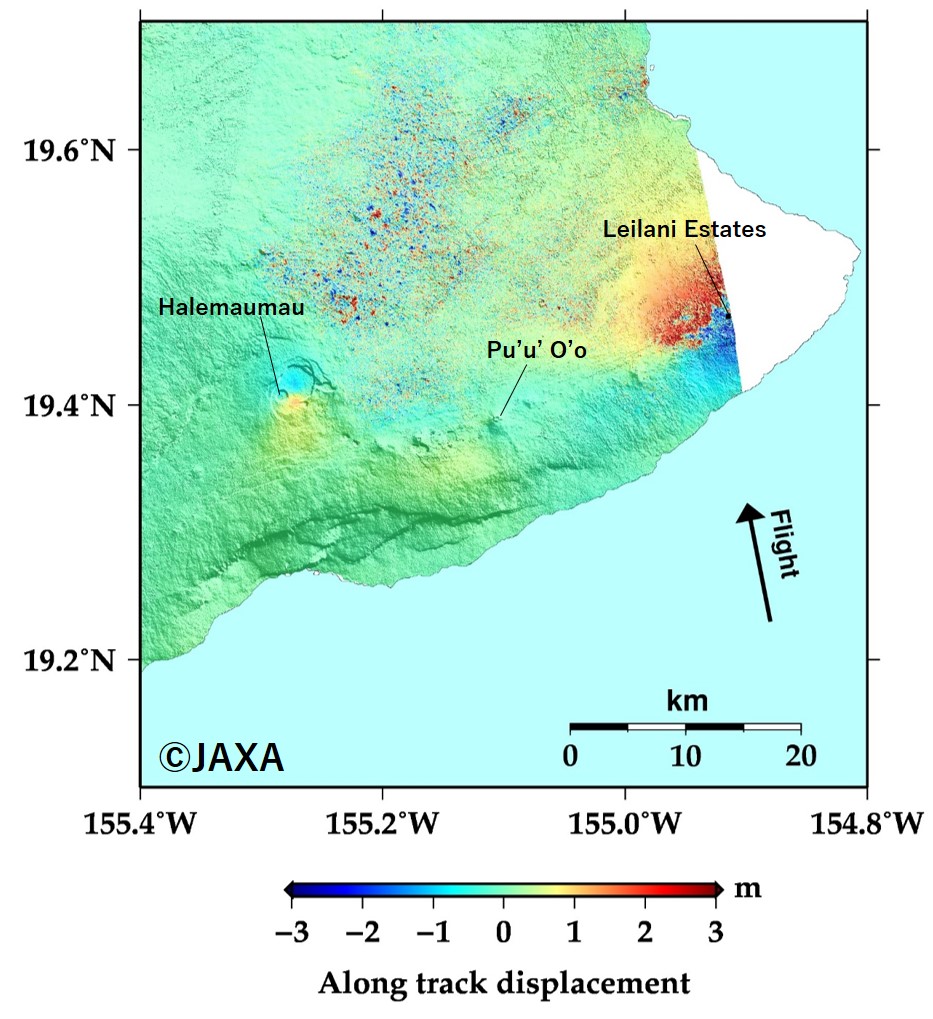 Fig. 5: A Multiple Aperture Interferometry image of the ALOS-2 PALSAR-2 data acquired on December 18, 2017 and June 5, 2018.
(Click to view enlarged image)
Figure 5 shows the result by Multiple Aperture Interferometry using the same data in Fig.4. This technique can derive a displacement along the direction of the satellite traveling (almost north-south). The image shows ~2 m displacement of north-south extension in Leilani Estates and ~1 m displacement of north-south compression around Halemaumau Crater.
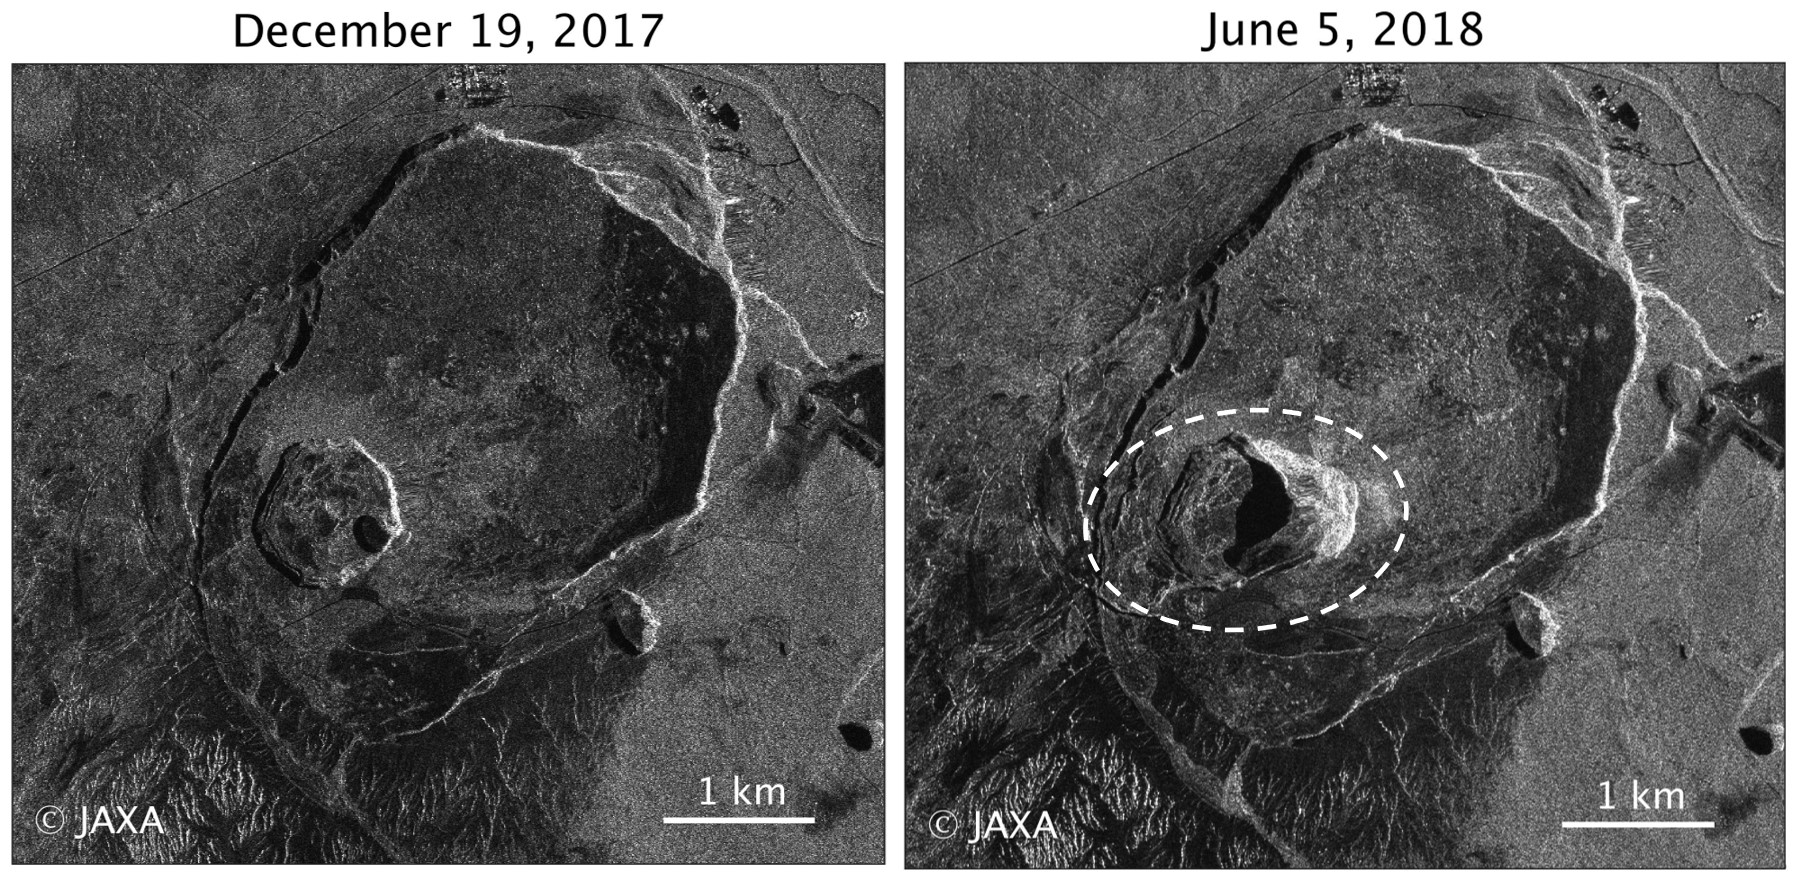 Fig. 6: Comparison of the two HH amplitude images acquired on December 19, 2017 and June 5, 2018. The white-dotted circle corresponds to the subsidence area.
(Click to view enlarged image)
Figure 6 shows a comparison of amplitude images on December 19, 2017 and June 5, 2018. There is subsidence of the entire Halemaumau Crater (white-dotted circle).
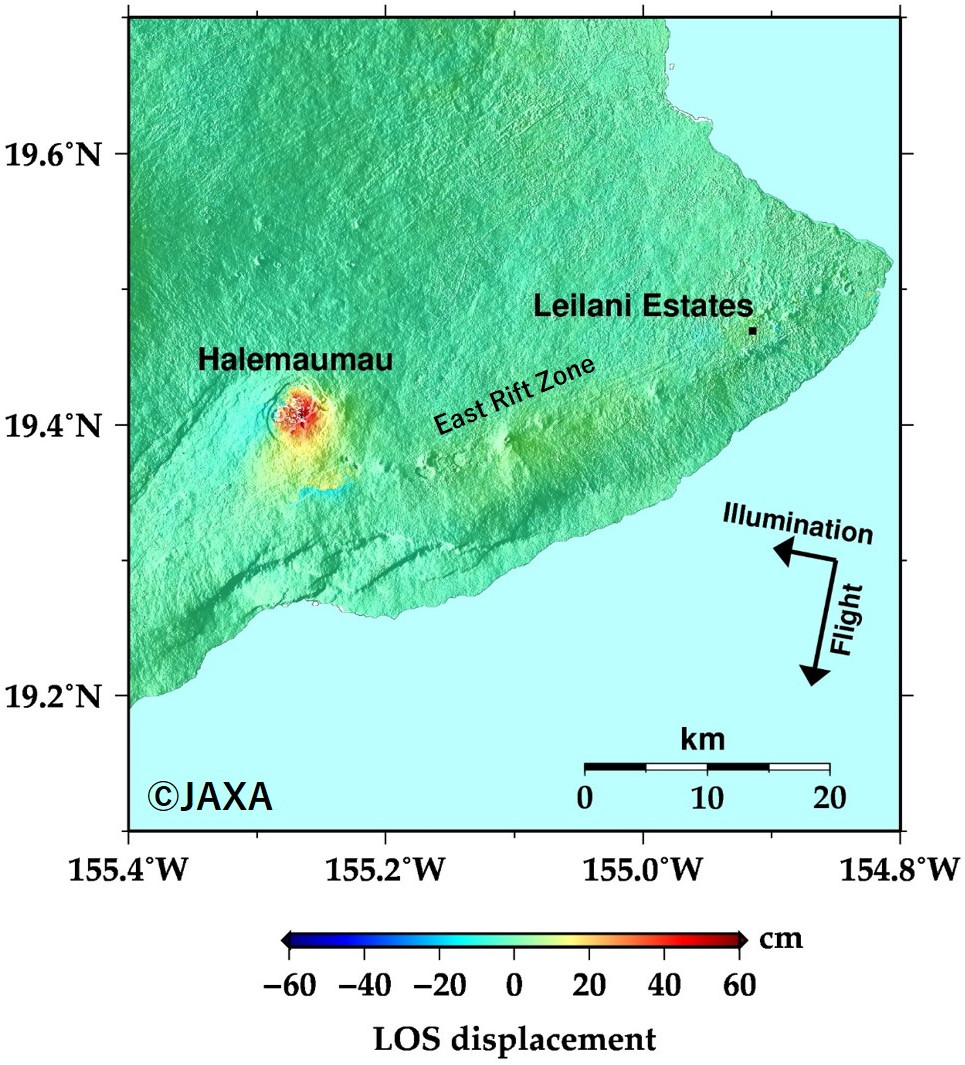 Fig. 7: An interferometric image of the ALOS-2 PALSAR-2 data acquired on May 26 and June 9, 2018.
(Click to view enlarged image)
Figure 7 shows the interferogram using the ALOS-2 PALSAR-2 data acquired on May 26 and June 9, 2018. This image shows ~50 cm displacement away from the satellite (subsidence or westward) around Halemaumau Crater.
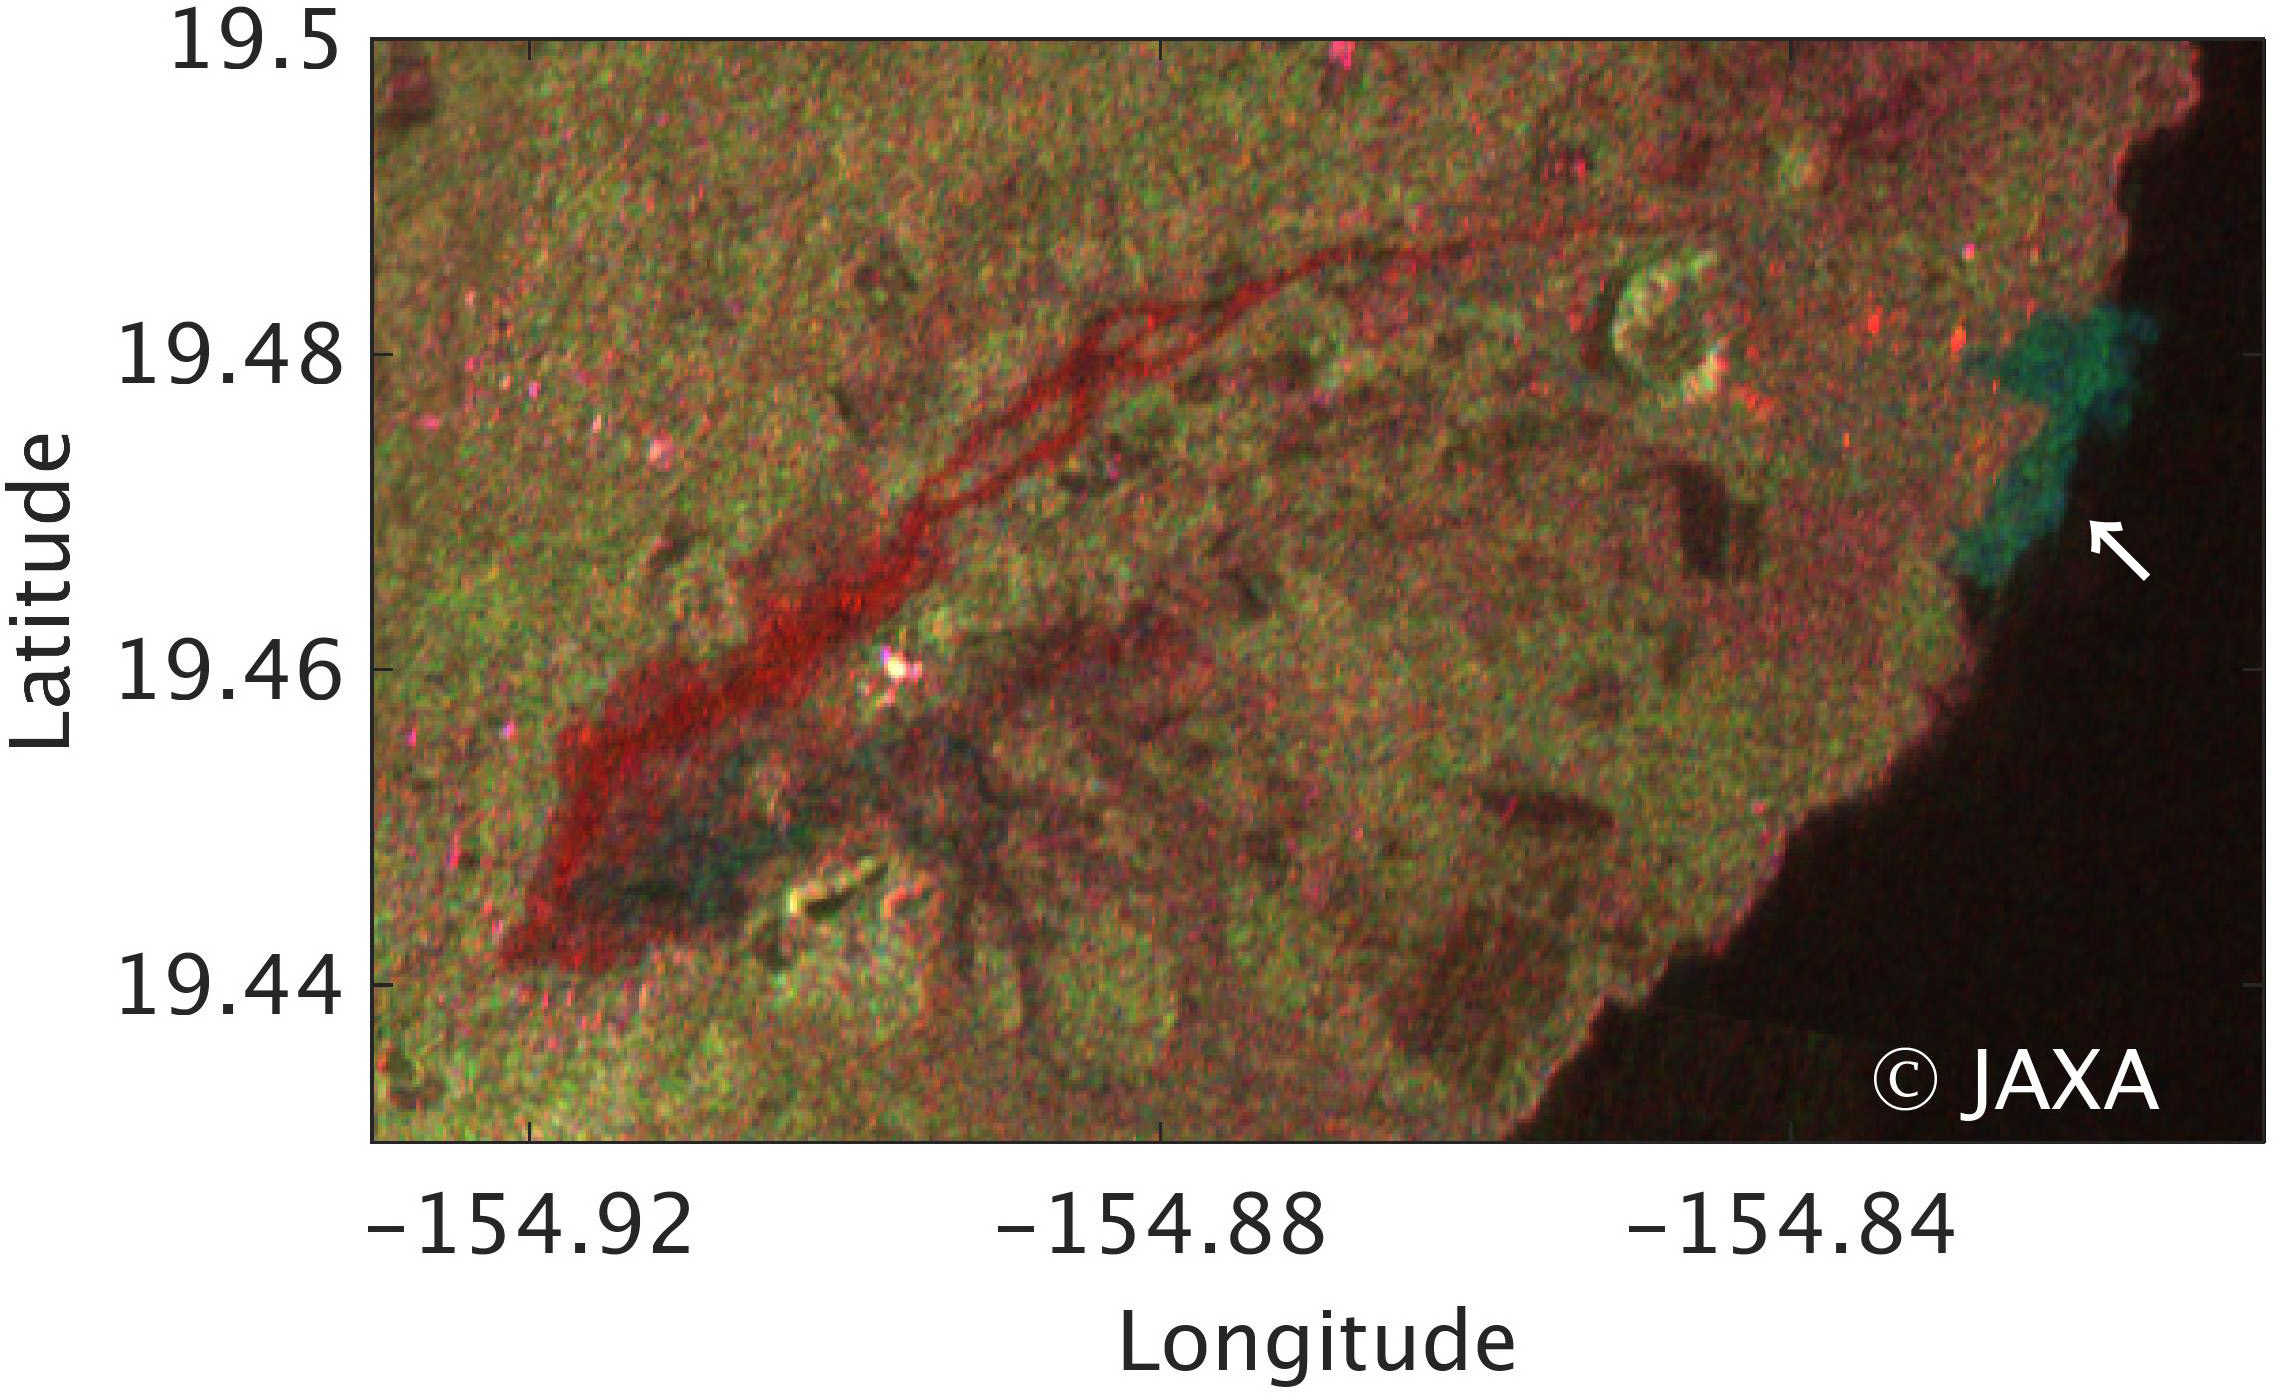 Fig. 8: Polarimetric color-composite image of the ALOS-2 PALSAR-2 data acquired on May 26 and June 9, 2018, around Leilani Estates.
(Click to view enlarged image)
Figure 8 shows a color-composite image (red: June 9 HV polarization, green: May 26 HV pol., blue: May 26 HH pol.) where eruptive fissures and lava flow can be seen in red color. This image shows that there is a path of lava flow from southwest to northeast and that a new land has been formed due to lava intrusion into ocean (blue area in Fig.8).
We will continue to monitor Mt. Kilauea by ALOS-2.
Reference:
ALOS-2/PALSAR-2 Observation Result for Eruption of Mt. Kilauea and Earthquake in Hawaii(2).
ALOS-2/PALSAR-2 Observation Result for Eruption of Mt. Kilauea and Earthquake in Hawaii.
About Multiple Aperture Interferometry.
© JAXA EORC
© Copyright 1997- All Rights Reserved.